A Picture is Worth a Thousand Words: Understanding Expectations and Mapping Preferences for Writing Classroom Design
Dana Gierdowski and Susan Miller-Cochran
Methods
To address our research questions, we conducted a survey at the beginning of the semester to ask students about their expectations for their first-year writing class. Additionally, we used a concept mapping technique where participants were asked to design their ideal writing classroom, given no budgetary constraints. Conceptual mapping exercises have the potential to shed light on student expectations, perceptions, and uses of spaces (see Fosters and Gibbons 2007). We wanted to use quantitative and qualitative data to inform each other in response to our research questions (Johanek 2000), knowing that the qualitative data gathered from the concept maps would help contextualize and strengthen our interpretation of the quantitative data gathered in the surveys.
Surveying Students
In the first phase of this study, our goal for the survey was to collect data that would help us better understand what incoming college students expect to experience in their first-year writing course. The expectations survey used in this study was adapted from the survey instrument authored by Gaffney et al. (2010) in their study of student expectations in SCALE-UP physics classrooms. In the first survey administered in Gaffney et al.’s study, students were asked to rate the frequency with which they expected to experience a variety of activities and interactions in their physics class (such as “lecture,” “laboratories separate from the rest of class,” and “to interact with my peers during class time”). With this framework in mind, we modified the instrument to include activities and interactions that are or could be associated with a composition classroom, such as “writing multiple drafts,” and “giving feedback to my peers on their writing.” In addition to these composition-related activities, elements of classroom design were also incorporated into the survey; for example, students were asked to rate how frequently (on a Likert scale from “always” to “never”) they expected to experience different kinds of classroom environments (i.e., “working in a computer lab,” “a classroom arranged with chairs/desks in rows”), as well as how much they expected to use certain kinds of resources and technology in their writing classes (such as “using my own computer during class” and “using LCD screens to view/share work”). The expectations survey was administered to students enrolled in English 101 classes in the program’s pilot classroom during the fall of 2012 and the spring of 2013 to obtain a large cross section of student responses. Instructors who taught the thirteen sections offered in the flexible classroom administered the confidential, online survey to their classes during the first week of each semester. A total of 371 surveys were collected over the course of these two semesters, and we looked at measures of central tendency in our analysis.
Making Conceptual Maps
We followed the expectations survey by inviting students to participate in a conceptual mapping exercise at the end of the fall 2012 semester. The use of conceptual mapping for this study was inspired by the methods employed by library researchers Nancy Fried Foster and Susan Gibbons (2007) and composition scholar Nedra Reynolds (2004). Foster and Gibbons ethnographically examined the study habits of students in relationship to their use of space so that they could incorporate data into the design of new library spaces. Borrowing from urban planning and design, Foster and Gibbons employed a charrette-style workshop where they asked students to design their ideal library study space.1 Their findings from the student designs included spaces that are flexible, comfortable, and provide access to technology and support resources. Although the needs of students in libraries may differ from their needs in classrooms, the charrette technique, as demonstrated by this research, is effective in gauging the expectations, perceptions, uses, habits, and needs of learners.
Mapping techniques have also been used by Reynolds (2004) in her research of student perceptions of the surrounding areas at the University of Leeds. Reynolds argued that the body “is imprinted with and affected by the spatial and social world in which it moves” (42). The term “mental mapping” denotes an individual’s “cognitive capacity to understand where things are in relationship to one another, sense of direction, or sense of distance” (82). She explained that mental maps hold “cognitive images in our own minds about a place, a route, or an area” (82); accordingly, they reveal much about how we perceive the world and the ideologies behind those perceptions. Conceptual mapping techniques such as the ones described above have the potential to shed light on the specific characteristics of a learning space that students prefer, which could be tied to a number of factors including their prior experience in learning environments before coming to college as well as how much they are influenced by the learning spaces in which they are currently situated as new college students.
Although the work of Foster and Gibbons reflects student habits in informal learning spaces in libraries and Reynolds's research examines attitudes of difference regarding spaces outside the boundaries of campus, conceptual mapping can be applied to formal composition spaces to reveal deeper, more nuanced information that students and instructors might not disclose via other methods of data collection. As Reynolds (2004) asserted:
The same geographies that construct our notions of gender, race, class, age, or abilities also construct spaces of learning, which in turn become particularly complicated or fraught with meaning. When students walk into classrooms, they come with years of experience walking into classrooms; each person’s mental map of past classrooms will be different. (p. 162)Our specific purpose in employing this method was to ascertain student preferences in classroom design and isolate particular features that all users considered helpful for their teaching and learning processes.
Gathering the Data
The participants in the conceptual mapping phase of this study included twenty-four students taking writing-intensive courses at a large southeastern university. Of the total number, twenty-two students were enrolled in the English department’s first-year writing course, English 101: Academic Writing and Research. The required first-year course at this institution is a four-hour, one-semester course taken primarily by incoming freshmen. One student in the study was enrolled in English 100: Introduction to Academic Writing, the department’s introductory writing course that students may opt to take if they feel they need additional preparation with college-level writing before taking English 101; and one student was enrolled in the department’s 200-level introduction-to-film class (English 282; see table 3.1).2 All maps were created after the student participants had completed almost a full semester of the respective writing courses in which they were enrolled.
Table 3.1 provides additional information about these student participants. We noted the classroom type (desktop, BYOT, BYOT/flexible, laptop, or auditorium-style lecture hall) in which the students were taking their current courses to be certain we had diverse representation from different classroom environments and to determine whether students’ current classrooms seemed to be influencing their conceptual maps.
| Student3 | Gender | Major | Course | Room |
|---|---|---|---|---|
| 2 | F | Chemistry | 101 | BYOT |
| 3 | F | Business Admin | 101 | BYOT |
| 4 | M | Undecided | 101 | BYOT |
| 5 | M | English | 101 | Laptop |
| 6 | F | English | 282 | Auditorium-style lecture hall |
| 7 | M | Chemistry | 101 | BYOT |
| 9 | M | Engineering | 101 | BYOT |
| 10 | M | Bio Medical Engineering | 101 | Laptop |
| 11 | M | Chemistry | 101 | BYOT |
| 12 | F | Undecided | 101 | BYOT |
| 13 | F | Undecided | 101 | Laptop |
| 15 | M | Bio Medical Engineering | 101 | BYOT/Flexible |
| 16 | M | Computer Engineering | 101 | BYOT |
| 17 | M | Civil Engineering | 101 | Laptop |
| 18 | F | Anthropology | 101 | BYOT/Flexible |
| 19 | M | Nuclear Engineering | 101 | BYOT/Flexible |
| 20 | F | History | 101 | BYOT |
| 21 | F | Elementary Education | 101 | Laptop |
| 23 | F | Sports Management | 101 | BYOT |
| 24 | F | Undecided | 101 | BYOT |
| 30 | M | Undecided | 100 | Desktop |
| 35 | M | Microbiology | 101 | BYOT/Flexible |
| 36 | F | Animal Science | 101 | Laptop |
| 37 | F | Animal Science | 101 | Laptop |
Table 3.1. Student participant gender, major, course, and room.
Participants were solicited for this study on the department’s email list, which all instructors subscribe to; in our message, we invited instructors to participate and asked them to share the invitation with students either via email or by way of an in-class announcement.4 Volunteers were invited to attend one of two charette-style workshops that we held over two days at the end of the semester, where they were asked to design their ideal writing classroom.
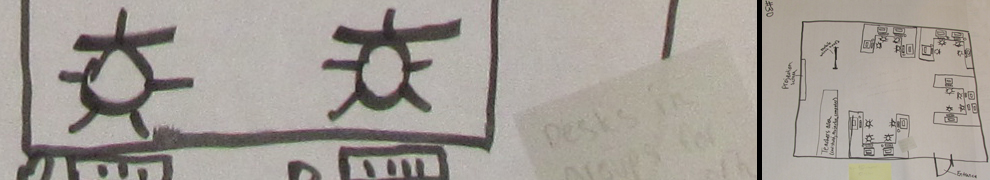
Incentives were offered to all volunteers, which included lunch and the opportunity to win gift cards to several local eateries. Each participant was given a large sheet of easel paper, markers, and self-sticking notes in several sizes to create his or her design (see figure 3.4). Before the participants began, informed consent was obtained, and they were directed to include anything in the space that they felt made a difference in their teaching and learning. Twenty-four student maps and twelve instructor maps were collected, for a total of thirty-six maps (see figures 3.5 and 3.6 for example maps). This chapter focuses solely on the data collected and analyzed related to the student participants (n=24).
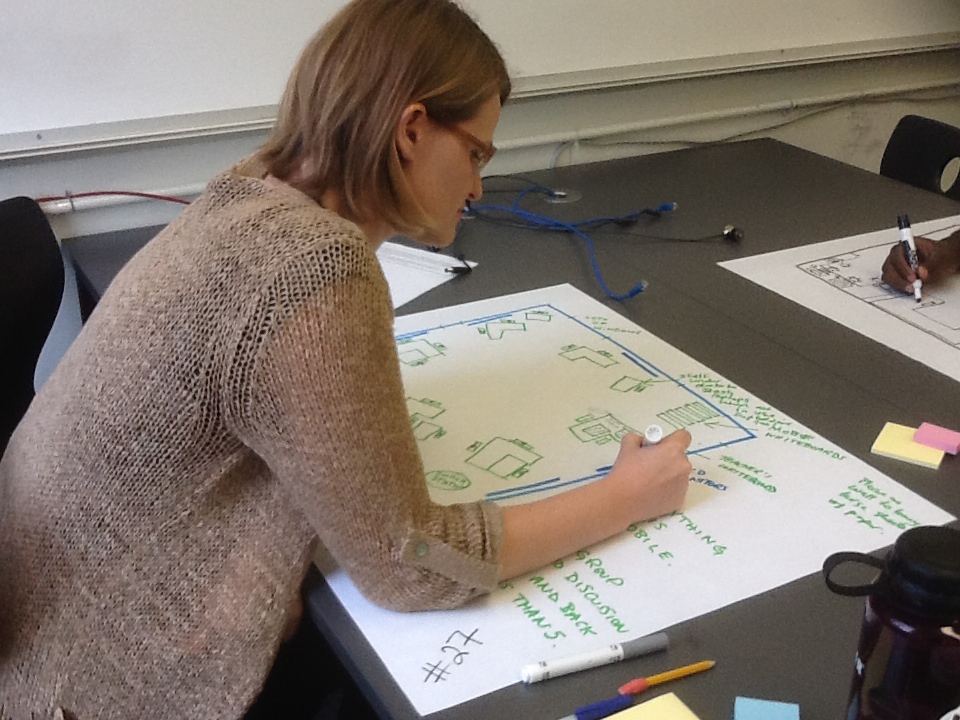
Figure 3.4. Participant creates conceptual map.
click image for full-size view
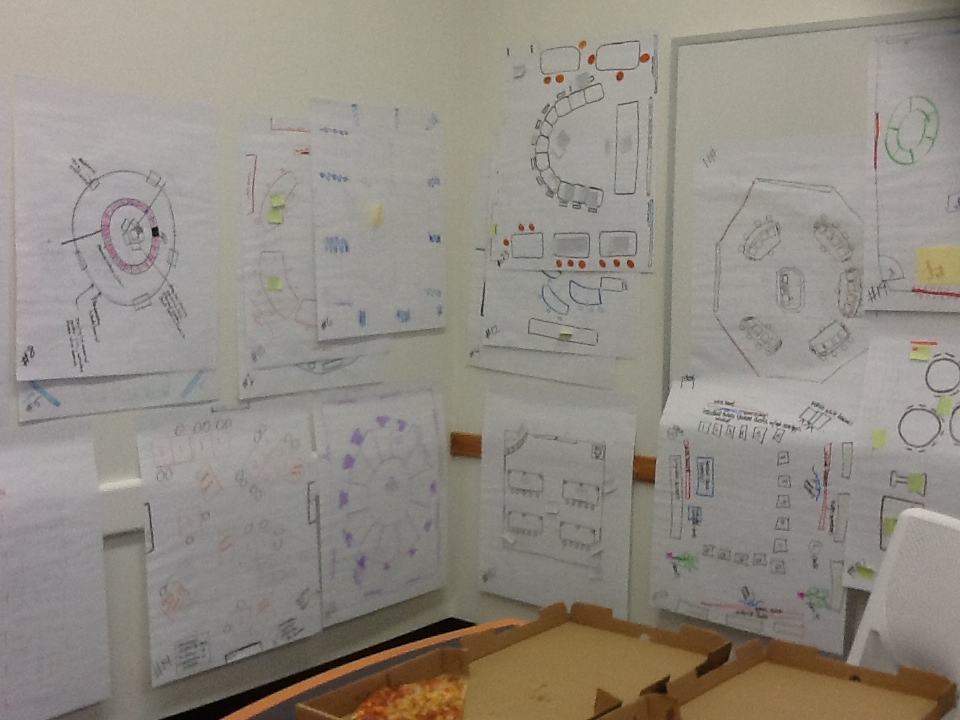
Figure 3.6. Sample conceptual maps.
click image for full-size view
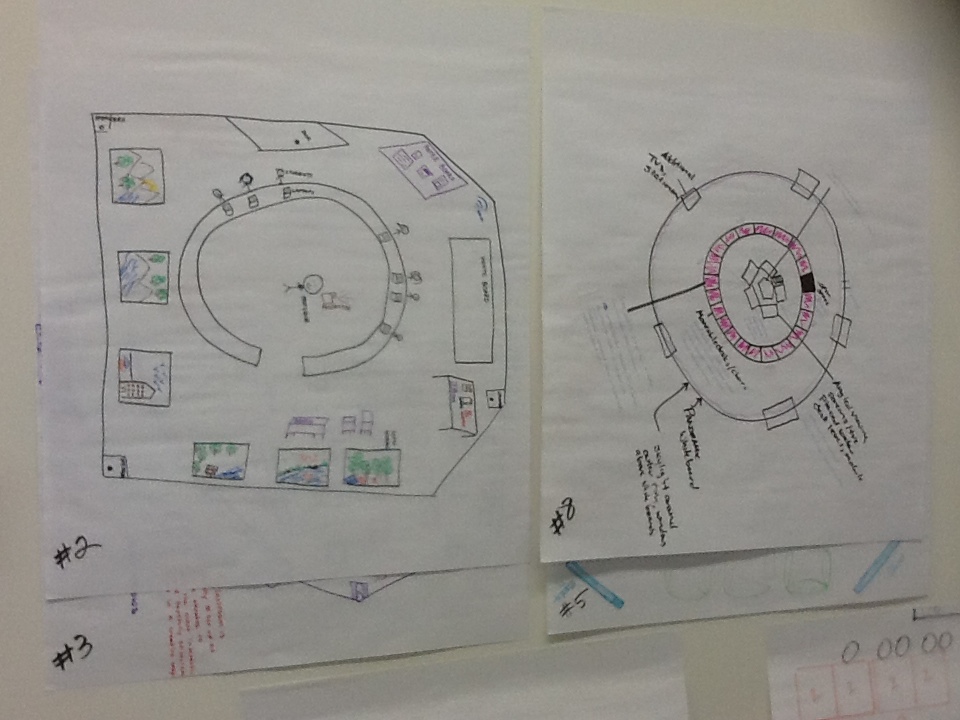
Figure 3.5. Sample conceptual maps.
click image for full-size view
Coding the Data
Using an emerging coding process, we reviewed several of the maps and then constructed a code sheet that included a number of prominent patterns and themes. Variables represented on our code sheet included resources participants included in the designs, such as type and shape of furniture (i.e., tables/chairs and tablet-arm chairs), provided technology (laptop computers, iPads, etc.), student-owned technology (laptop computers), types of projection and/or display equipment (LCD screens, Smart Boards), and varying kinds of writable surfaces (i.e., fixed whiteboards, mobile whiteboards). In addition to these variables, we also included a category on our code sheet to note where participants positioned the instructor in the space (such as front, center, or corner), how they arranged students in the space, and if they indicated those positions as mobile. Additionally, we included a category for different room aesthetics, such as wall color and number and position of windows.
Using our code sheet, we analyzed each of the maps to determine mutual agreement; a sample of 10 percent of the data was then given to an independent rater for reliability testing. The results of the reliability testing were calculated with Cohen’s kappa; the strength of the weighted kappa was .805 (“very good”) with a 95 percent confidence interval in relation to the categories from our code sheet.
Footnotes
1. A charette is defined as the “creative process akin to visual brainstorming that is used by design professionals to develop solutions to a design problem within a limited timeframe” (Aurand).
2. English 100 is a four-hour course that counts as elective credits for students. Students are asked to take a self-assessment inventory to aid them in their placement decision.
3. Participants were assigned identification numbers in the order in which they arrived at the mapping workshop; as a result, student numbers were interspersed with instructor identification numbers and do not always follow sequential order.
4. Some instructors in the Department of English shared this email with students in classes outside the first-year writing program, which is how a student in the introduction to film class became a participant.