Tools abound these days to streamline (or, sometimes, complicate) the collection and analysis of data. Some digital data tools even make the impossible possible, allowing us to visualize phenomena we have never been able to capture or analyze before. These digital tools are transforming, for better or worse, the way we do research as digital scholars. Whether grappling with “big data” or conducting in-depth case studies, digital technologies are shaping the way we interact with and therefore come to understand the data that informs our policies, dissertations, and digital projects.
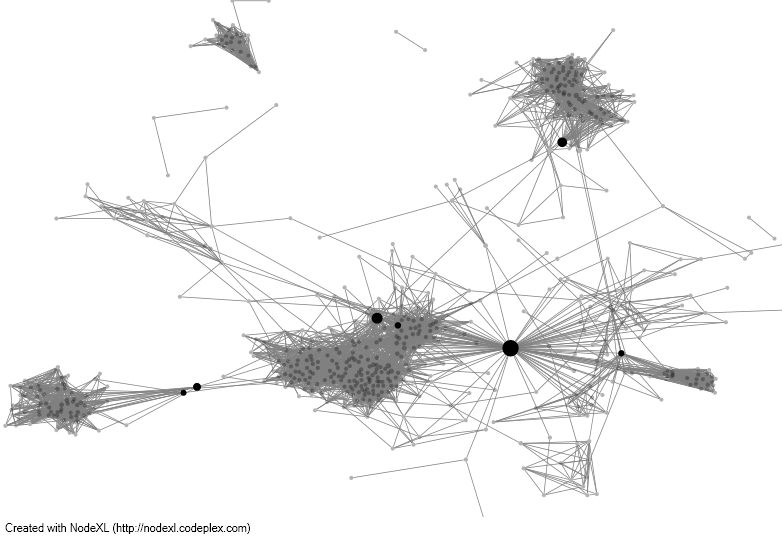
A personal example: my dissertation research examines teachers’ social networks, and how these networks inform teachers’ digital literacies and pedagogical practices.  Thanks to open-source tools like Gephi and add-ons like NodeXL, I am able to download data about teachers’ digital connections in media like Facebook, Twitter, LinkedIn, or Flickr, and then analyze that data through the development of network graphs. This network graphic, for example, shows the Facebook network of a teacher with whom I worked during my pilot research. The circles, or “nodes” in network speak, represent the teacher’s “Facebook friends,” and are sized and colored to reflect the centrality of individuals within the network based on their “bridging” capacity. On an analytical level, this helps me identify who might act as a social media “bridge” for the teacher between social spheres — who has access to multiple social groups within this digital network? who is a member of multiple groups, moving with her between social spaces both in her physical day-to-day life and in her virtual life? Graphics like these, paired with qualitative data, help me answer these questions.
Many of us are doing innovative things with digital and digitized data in the humanities and social sciences, exploring data analysis using both “new” and “old” digital tools, repurposing some technologies to fit our needs, and even developing our own tools when our needs cannot be met by existing resources. That’s where you come in. How do you manage your data — digital or otherwise — using digital tools? Perhaps you have found an open-source tool that will help your fellow graduate students and faculty. Perhaps you were introduced to a widget that helps you capture and archive web data.
We want to hear from you! Whether you are a graduate student or faculty member, whether you are doing innovative things with Microsoft Word or diving into the latest new app for photo archiving, we want to know how you use digital tools to collect, analyze, or leverage data for your research purposes.
To Contribute to the Fall Blog Carnival, you have two options:
- Email, Tweet, or Facebook me, Liz Homan, a link to a post on this very topic! You can post on your own blog, and we’ll post a link on DRC to your carnival contribution.
- Send me an abstract (~250 words) for a post you would like to contribute as an author on DRC. We will review abstracts and posts in the coming few weeks and schedule them to be published on the DRC site.
We hope you can include screenshots and examples in your post, as well as links to any relevant resources or guides that might help us learn how to use these new tools. As for me, I will be posting about my use of NodeXL and Gephi, along with some relevant resources, sometime in the next month. Happy writing, everyone, and I hope to hear from you soon!

2 Comments
For any readers in the New England area, there will be a Boston DataSwap / skill-a-thon held 10/17/13 that introduces people to many of these tools. See more info, and register for free here: http://dataswap2013.com/.
Thanks, Alicia!