Welcome to the first post of the DRC Fall Blog Carnival! We are looking forward to many interesting posts about the creative things people are doing with digital and digitized data in the humanities and social sciences (and we’re still scheduling posts if you want to contribute!). I’m going to get us started with a few words on my use of three digital tools for examining network data, which surrounds us on a daily basis. Use Facebook? You’re generating network data. Twitter? Data. Email? Network data, again.
We’re surrounded by, and members of, thousands of networks. Some of these are digital – you likely maintain professional connections that are entirely online with people you have never met face-to-face. Other networks are non-digital – or at least, do not originate in digital spaces. For example, your family comprises a network of individuals whose ties to one another are primarily defined by “being related.” Today, these non-digital networks overlap with digital networks regularly, as happens when you share photos with family on Facebook or tweet back and forth with friends and colleagues. Network visualization tools attempt to “capture” these complex networks in time, allowing researchers to analyze their features, to compare them to other networks, or to build statistical models based on network characteristics.
I began using social network analysis a few years ago. My dissertation research examines high school teachers’ uses of digital technologies in the classroom — how they learn about them, when they use them, when they don’t, and why. In my pilot research, I found that teachers’ colleagues play a major role in when, whether, and how they will take up a new digital technology with students. I sought a way of capturing these connections and tying them to teachers’ digital practices, and arrived at social network analysis, a field built on theories and methods that are growing in popularity in the social sciences but have not yet been employed by many humanities scholars.
There are too many network analysis programs out there for me to tell you about all of them, but here are some links to and descriptions of my personal favorites – favorites because they are relatively user-friendly, are free to the user, and are (sorta) simple to learn how to use.
Gephi

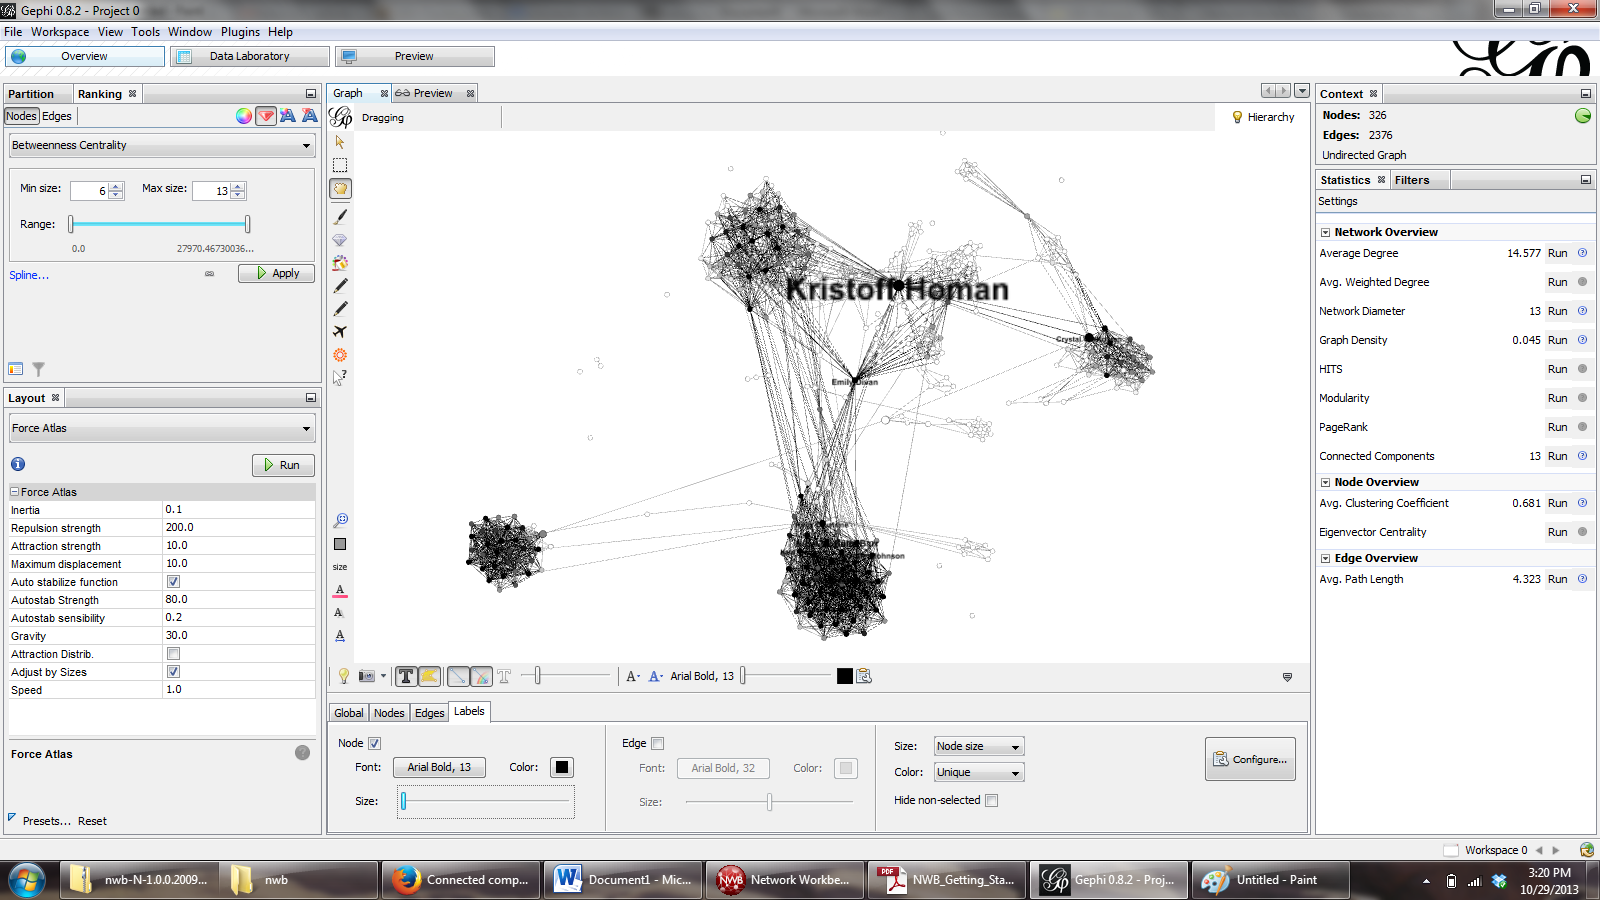
Gephi is one of my favorite tools because of the beautiful graph visualizations it generates. To analyze a Facebook network in Gephi, you first must visit Netvizz (or have your participants visit this site) and follow the instructions to pull down your social network data. There are other methods for obtaining data and preparing it for Gephi, as well. Once your data is in Gephi, you can use the software to calculate metrics that will tell you more about the density of the network (how many connections exist in the network relative to how many connections are possible) or the number of weakly connected components in the network (“groups” that are connected to one another but within which individuals are highly connected to each other).
This screenshot shows me working with my own Facebook network. I have scaled individuals’ labels and node sizes by “betweenness centrality,” or the degree to which they act as “bridges” in my network. The largest name is my partner’s – he’s my biggest “bridge” between groups, a finding supported by recent studies examining individuals’ Facebook connections. My sister, Emily, is my second-biggest bridge. I could examine other metrics with this graph, too — such as “degree,” or the person in my network with the most mutual friends, or even other attributes, such as interests in music or relationship status. One could easily import network data from research participants’ Facebook networks, as I did in my pilot study, and compare these networks to other networks in participants’ lives or to content from the site, depending on one’s research questions.
NodeXL

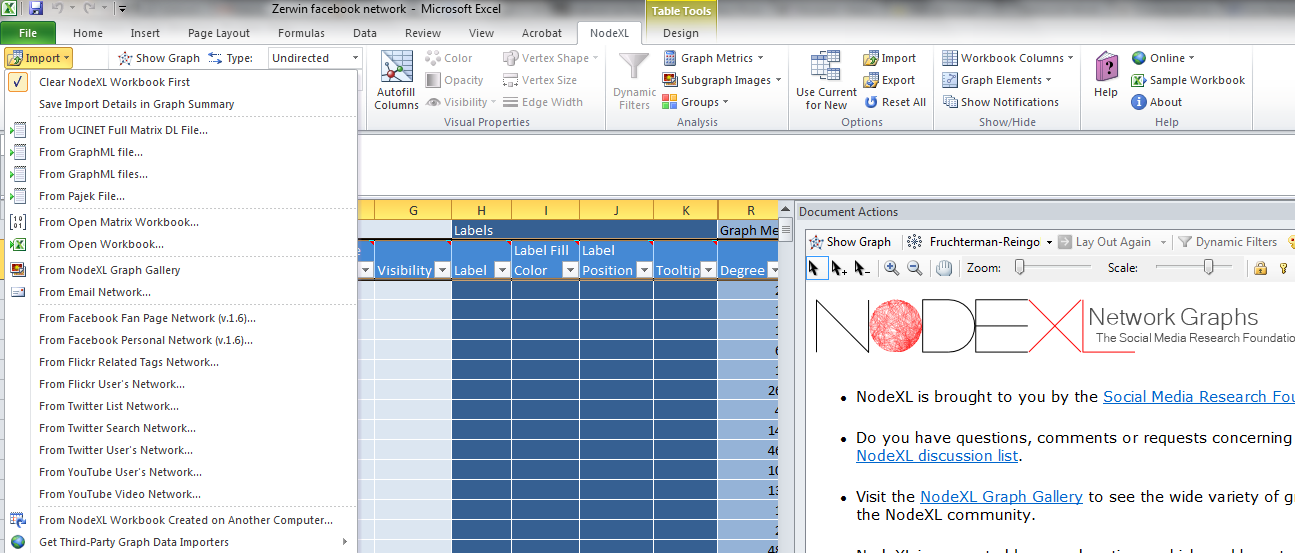
Similar to Gephi, NodeXL allows for examination of media networks, among other things. I like it for two reasons: (1) It is a plugin for a familiar software package, Microsoft Excel, and (2) I can import network data from Twitter and Facebook from within the extension.
This screenshot shows the various data import options, along with the basic interface. Because data is collected into an Excel spreadsheet, is it also possible to export this data into other network program file formats, including GraphML (which is Gephi-compatible).
You can create network visuals within NodeXL, as well, though the options for manipulating your graphs are more limited than in other visualization environments. However, NodeXL is an easy-to-use space for analyzing network data, and can be a great place to start and to learn the basics. To learn more about it, visit their website, which is full of resources and fora for beginning and advanced network researchers, or check out this book about NodeXL and how to use it (includes step-by-step guides with screenshots — if only guides like this existed for all digital research tools!)
GUESS
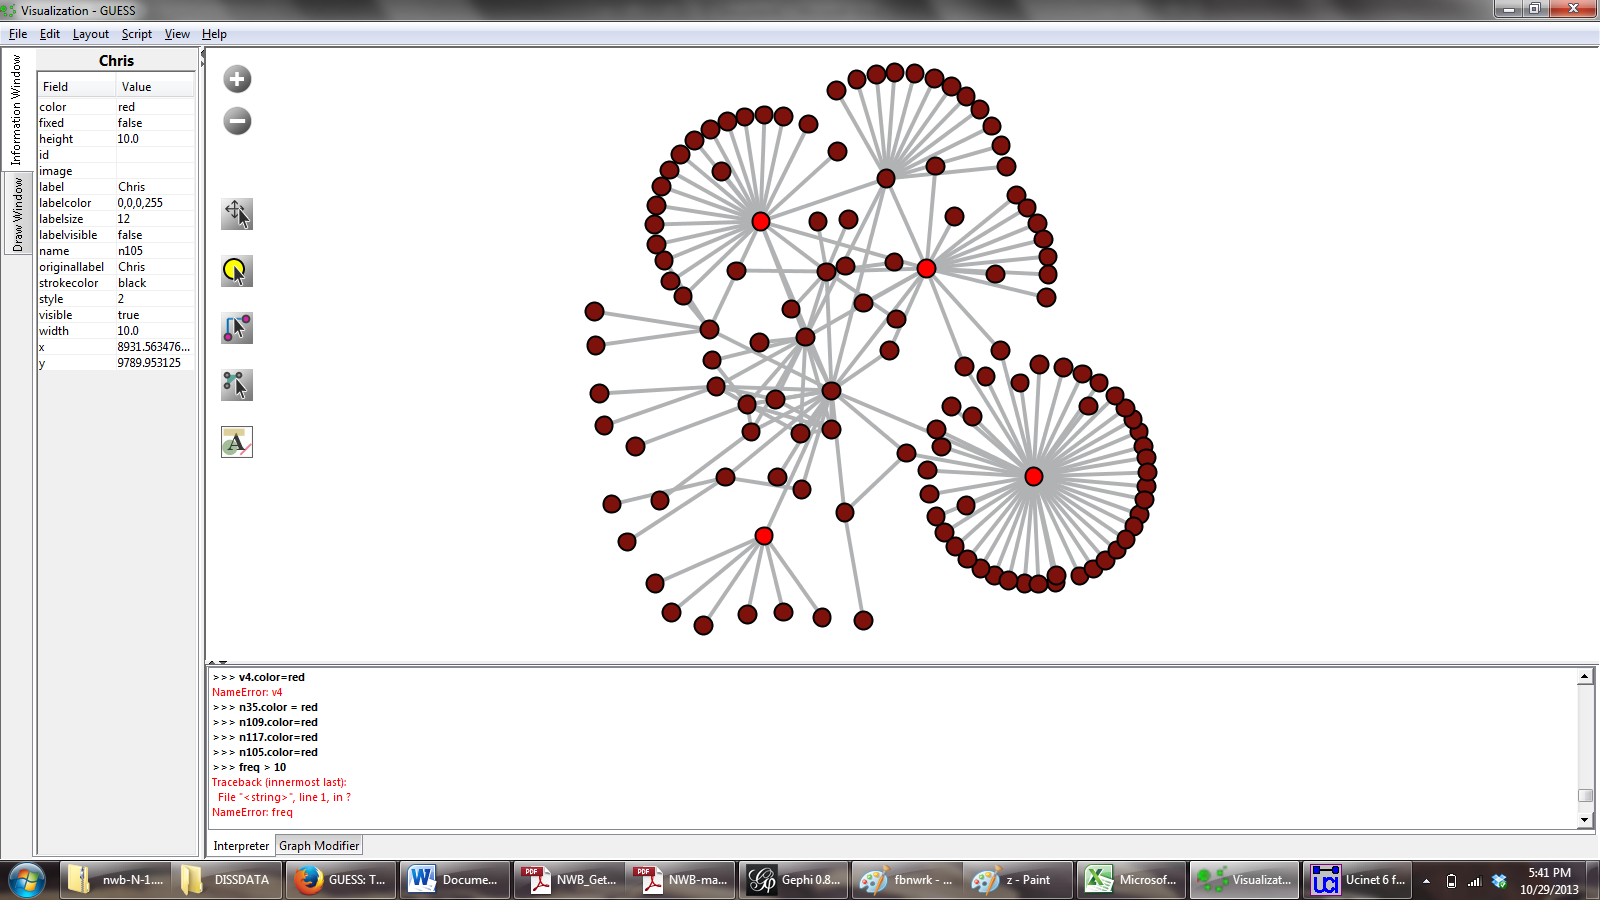
I am only just beginning to learn how to use GUESS, and I have yet to import my own data into this space. The power of GUESS is in its language – instead of using a bunch of dropdown menus with esoteric network terms, GUESS relies on its own language, Gython, an extension of Python. Commands in the lower box allow you to manipulate the visual elements of the graph, such as the color of “nodes” (individuals) and “edges” (their connections).
In this screenshot, I am playing with “toy data” (which the developers thankfully provide as part of the downloaded package) and trying to learn some of the commands. As you can see in the script box at the bottom, I’m encountering many error messages along the way – all part of the learning process! The advantage of GUESS is certainly in the control the user has over network visuals. The problem? You’ll need to learn some programming language to use it!

Why Analyze Social Networks?
Many scholars today are asking questions about the role of social connections on individuals’ behaviors, or about how networks shape our understanding of the world. Whether you want to know how one’s Facebook friends impact their interest in school, how participation in online affinity spaces reflect one’s beliefs about reading or writing, or how Twitter interactions correspond with scholarly activity (to name a few examples), network analysis provides a means to investigate these issues, and (I posit) is even more powerful when used alongside qualitative methodologies.
Beyond graphic analyses like the ones I mention here, network researchers also use programs (like UCINET, Pajek, KliqueFinder, and Network Workbench) to conduct intensive statistical analyses of network dynamics. Certainly, many scholars in the humanities and social sciences do not necessarily have the statistical training to conduct analyses like these — however, collaborations between and across fields could open up conversations about the nature of ties in digital and non-digital networks, offering a humanitarian view to existing perspectives in network science.
I’ve only scraped the surface here, so if you want to know more, please feel free to tweet or email me! I’m always happy to talk networks, and to learn more from any of you who have experimented with network analysis and/or network visualization.
And stay tuned for upcoming posts on data in the digital age! We have a number of exciting topics in the queue.
