
Progressing through the Information Age, Big Data has come to the attention of many in the humanities, at times even eclipsing the importance of other forms of data (Cheryl Ball, Tarez Samra Graban, and Michelle Sidler have written about Big Data v. Boutique data in this carnival). Although the definition for this era is fraught with challenges, one of its hallmarks is the increase in data quantity and the ability to work with that data. Simply put, the omnipresence of computers in every aspect of human life means we’re recording and capturing ever-increasing amounts of data. The problem is that data in isolation don’t speak for themselves, at least not well. Instead, we have to find ways to effectively communicate that data, to make accessible to our audience the story we find in the data.
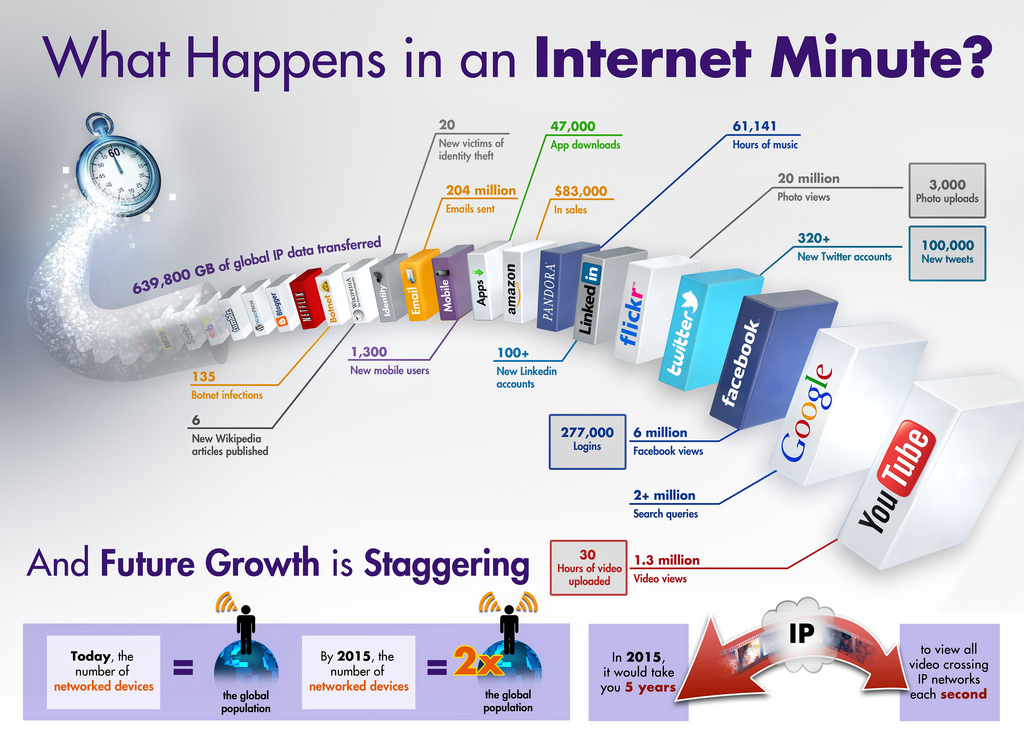
One medium–one that I’m still researching and learning about–that’s arisen recently for communicating all this data is the infographic, a means of presenting information visually. The infographic (a portmanteau of “information” and “graphic”) combines visuals with alphabetic and numeric expressions, often with multiple visualizations–charts, graphs, diagrams, and other visuals, all combined with alphabetic and numeric text. While infographics are a popular medium sometimes focused on communicating popular topics—both with and without numbers, infographics can also deliver graphical presentations of researched statistical data. Here’s just one example of what an infographic can look like in its presentation of data.
While I’ve just begun working with infographics, I am developing a theory that suggests that infographics are a two-part data analysis tool: First, rhetors can analyze their data using the data visualizations that typically occupy the infographic, and second, the composition process for creating an infographic can itself be a form of analysis. At both stages, rhetors make ethical decisions about accurately conveying the information their data suggests using this visual format. (I’m indebted to DRC Fellow Liz Homan for helping me think through this theory.)
Information designer David McCandless talks about the benefits of data visualization for analysis and contextualization of data in his TED talk:
https://www.ted.com/talks/david_mccandless_the_beauty_of_data_visualization
Back when I was processing the data I’d collected for my thesis on online peer review, I went about data crunching the old-fashioned way—creating my own database, marking up my data and entering records in the database, and then exporting processed data into Microsoft Excel for creating graphs and charts. While I was ultimately interested in communicating to my readers, I was first focused on visualizing my data, trying to detect trends, spot outliers, and identify notable findings for myself.
In the same way that I was using spreadsheet charts and graphs as a new way of looking at my data, infographics can be a tool for researchers to examine data. While I haven’t yet processed a lot of data in infographic form, I am interested in exploring the infographic as a way to both begin and continue the process of communicating with an audience.
Several websites, including IBM and Google sites, support the analysis of data sets.
IBM’s Many Eyes promotes its data visualization tool as enabling users to see relationships between data points, to compare data sets, to track trends, and so forth. Many Eyes also includes the ability to work with more than numeric data in order to create visualizations of alphabetic text. All the Many Eyes data visualizations are publicly available and registered users can comment on other visualizations.
Google’s Fusion Tables site allows for, among other data processing, collaborative data gathering, enabling users to merge data created by different people into one location. Another interesting feature about Google Fusion Tables is that the site supports the visualization of data tied to geography in association with Google Earth. Google also supports traditional spreadsheet-style data views as well as more graphical views of the data.
Regardless of the data analysis tool, rhetors have a range of choices for presenting their data visualizations. Graphical output formats include a variety of statistical representations, such as bar, pie, and bubble charts, line and stack graphs, and Venn diagrams, as well as graphic symbols. Using either traditional graphics software or dedicated infographic creation websites, rhetors assemble these figures over a background. Rhetors often combine multiple statistical representations, as well as text, into the conglomerate known as the infographic. The process of this assembly may help rhetors see their data in a new way. William Faulkner is often attributed as saying, “I never know what I think about something until I read what I’ve written on it.” Perhaps similarly, we never know what our data say until we see what we’ve visualized.
1 Comment
Pingback: Visualization as sensemaking: experiences from approaching a large dataset — Digital Rhetoric Collaborative