Methodological Play
Methods of Data Collection and Coding
We turn here from a broader discussion of methodological frameworks that influenced our design of the project to a more detailed articulation of the specific methods that we employed to gather and analyze the texts in our corpus. As we developed our data collection and coding procedures, we were especially influenced by Mark Faust and Mark Dressman’s data-driven historical work (2009) on poetry pedagogies in English Journal because it offered a model designed to uncover information similar in scale and sentiment to our own. In their study of poetry articles in English Journal from 1912 to 2005, Faust and Dressman located articles relevant to poetry by skimming the titles and content of each issue, managing their collaboration by reading and systematically coding alternate years (117). They frequently conferred about their coding procedures and refined their coding scheme as they went through the years, relying on grounded theory methods (Corbin and Strauss 2000). Major distinctions emerged between what Faust and Dressman labeled “formalist” (i.e., canonical and analytical) and “populist” (i.e., more playful or experimental) approaches to teaching poetry (117). The authors plotted references to teaching poetry along a timeline in order to demonstrate the crests and troughs of these two categories over time (121), allowing them to discover some surprising trends as they worked through the corpus. For example, Faust and Dressman demonstrated the prevalence of the populist approach to teaching poetry during the heyday of the New Critical movement, a period that the pair had thought would trend towards more formalist pedagogy given New Criticism’s view of poems as “timeless, self-contained, precious objects” of study (116–117). In this way, Faust and Dressman’s work inspired us by demonstrating how collaborative, systematic coding of a large time period of English Journal can challenge common assumptions we often make about the field of English studies.
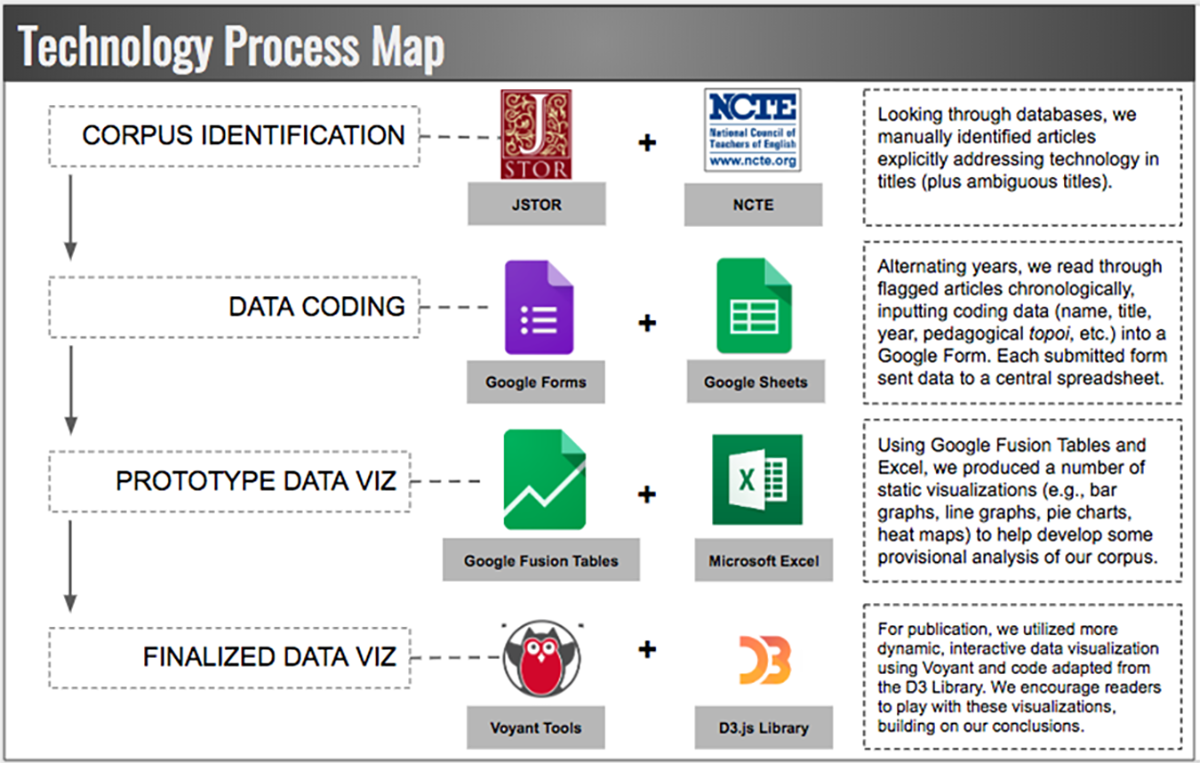
Adapting Faust and Dressman’s approach for gathering and analyzing data, we reviewed titles of the first hundred years of English Journal articles—sequentially and chronologically—in JSTOR (and once we exhausted the archives there at the time, the website for the National Council of Teachers of English). We flagged and subsequently read those that explicitly mentioned media or technology in the title. In addition to flagging obvious articles that highlighted technological media in their titles, we followed up with a second-pass review of ambiguous titles that might also allude to our subject; for example, a title such as “Vitalizing Literature Study” (Coulter 1912) was ambiguous so we opened the PDF, read it, and discovered that it addressed the use of the lantern (a precursor to the overhead projector) to display imagery associated with literary texts. Although we recognize that the book, the pencil, and the pen are all technologies (Baron 1999; Eisenstein 1979; Ong 1982), we did not track mentions of these tools, as they are ubiquitous in English studies scholarship, and doing so would have made our corpus too large to be manageable. While we did not code articles that focused on students’ reading print books or writing hand-written texts, we did code articles that described students and teachers actively using various print-based production technologies such as typewriters, printing presses, and photocopiers, although explicit discussion of these print tools was less common than we initially expected. In total, our corpus includes 766 individual articles and columns.
At the outset of our project, we developed a tentative coding scheme to categorize the most prevalent pedagogical orientations and ideological topoi we noticed in the articles. Having devised a coding scheme for the various criteria we encoded, we entered data into a Google Form, which would in turn populate a spreadsheet in Google Drive. Early in the process, we initially refined our coding scheme by reading and coding the same sample years, afterwards discussing how we arrived at certain decisions and developing a shared understanding of our criteria. Once we achieved a comfortable degree of agreement, we then read alternate years, periodically reviewing and conferring about each other's coding. On a few occasions, we refined our coding scheme in response to data we noticed as the process unfolded; for example, during our reading of the 1930s issues of English Journal, we noted that what we would eventually call “requiring the aesthetic/moral judgment of the teacher” was a pervasive argument about new media in the articles; we added this criteria to our new media topoi coding scheme and reviewed the earlier articles to account for it.
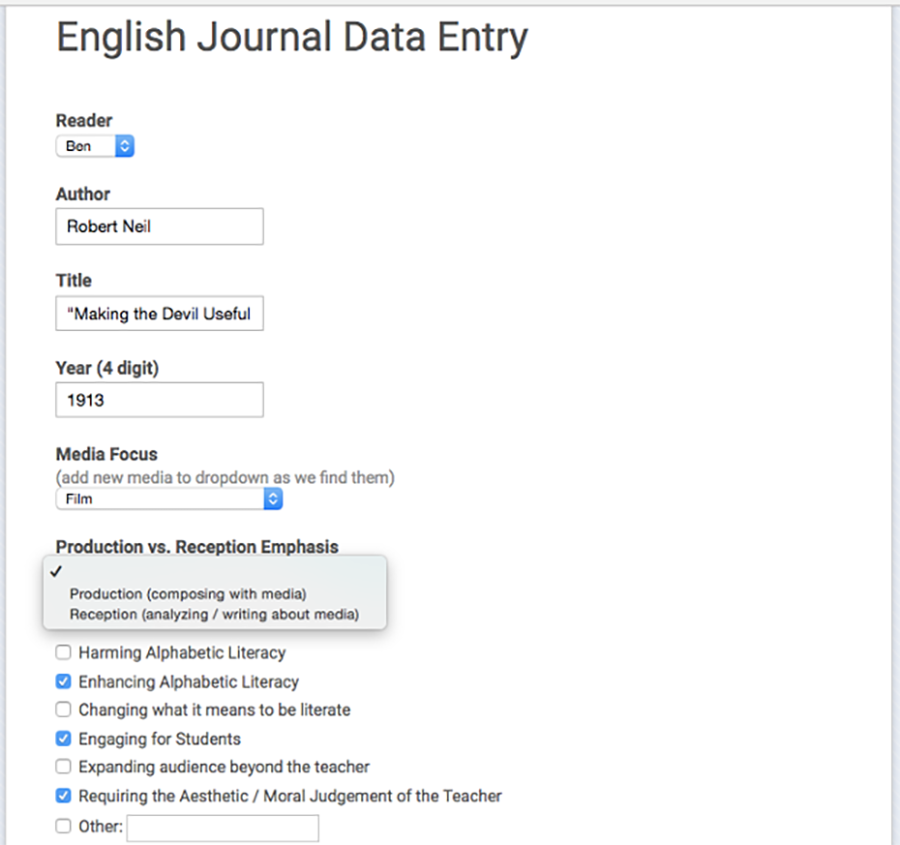
Seeking to track the particular ways new media technologies were used in English classrooms, we categorized each article we read as either focused on teaching “media reception” or “media production.” Articles focused on “media reception” emphasized teaching students to critically analyze or appreciate media texts; for example, we coded as reception articles that engaged students in having a class discussion of a film (Turner 1931), writing a paper summarizing events in a television news broadcast (Hainfeld 1953), or analyzing the credibility of a website (Gardner et al. 1999). In contrast, “media production” articles emphasized students composing texts using new media technologies and/or composing texts that were inspired by new media genres. For example, an article about students and teachers collaborating with a local radio station to produce radio broadcasts was coded as “media production” (Nelson 1939), but so too was an article about students writing and performing a radio script for a live audience using a replica microphone (Campbell 1936).
Given the historic and ongoing inequalities of access that permeate educators’ uses of technology (Banks 2005; Hawisher and Selfe 2004), we thought it important not to privilege the use of particular expensive tools, but rather to embrace an inclusive definition of media production that included students composing in “new media” genres (e.g., the dramatic film, the radio broadcast, the television commercial) using whatever media they had at hand. Although we coded “media production” and “media reception” as mutually exclusive categories, it is important to note that there were some articles that blended both approaches. When we coded an article as “reception,” this designation meant that there was either no mention of students composing media texts or that media production was mentioned only in passing, in a sentence or two without any substantive development. If we coded an article as “production,” this meant that the entire article focused on media production or that the article described a mix of reception and production activities, but (at the very least) it described those production activities in some detail.
In addition to coding for “production” versus “reception” emphases, we also coded for pervasive topoi about new media (Huhtamo 2011) that we found in the articles. Uncovering some of the most prevalent topoi about new media that have influenced English studies pedagogy over time can help us critically recognize and reevaluate the assumptions that have both constrained and enabled our field’s engagement with new technologies. With our coding scheme, we tracked six topoi about new media that were particularly pervasive across the corpus, noting moments when the articles implicitly or explicitly argued that new media were:
- Harming alphabetic literacy
- Enhancing alphabetic literacy
- Engaging for students
- Changing the nature of literacy
- Expanding audiences beyond the teacher
- Requiring the aesthetic/moral judgement of the teacher
Many of these topoi were referenced simultaneously within individual articles so they could not be coded as mutually exclusive categories.
We also coded whether the articles focused on teaching multimodal literacy, alphabetic literacy, or both. Although we recognize that even standard print texts have multimodal elements (Ball and Charlton 2015; Kress 2010; New London Group 1996), we only coded articles about computer-based or typewritten texts as concerning “multimodal” literacy if they included explicit reference to visual or other non-alphabetic features (e.g., layout, typography, multimedia). Similarly, although radio, film, and television are clearly all multimodal media, we only coded articles about these media as concerning “multimodal literacy” if they included some explicit mention of how engaging these texts necessitated paying attention to visual, auditory, and/or gestural forms of communication.
For each article, we also recorded standard bibliographical data including title, author(s), journal issue, volume number, and year. We also made an effort to track the gender of the authors; however, this was a challenging and imprecise process. In most cases, article authors did not explicitly identify their gender identity within the text and, given the span of our archive, it’s not possible for us to use person-based research to ask authors to define their own gender identities. Recognizing these limitations, we chose to make our “best guess” of author gender based on our subjective sense of genders commonly associated with their first names. In doing this, we recognize that we likely miscategorized the gender of some authors, as stereotypically gendered assumptions about first names do not necessarily reflect how the authors personally identified on the gender spectrum as women, as men, or as a wide range of non-binary identities. Although we recognize that attempting to code for author gender based on names alone is a problematic practice, we have decided to still report our very provisional, aggregate results about patterns in gender of authorship of English Journal articles, as they raise some interesting questions about how the politics of gender influence how we historicize technological pedagogies.
Full-text, Word Frequency Analysis
In addition to our own human-based coding of the articles, we also have employed the online text analysis toolkit Voyant in order to conduct a word frequency analysis of the full text of the articles in our corpus. We manually created text files of the articles by copying and pasting the text from the JSTOR PDFs, first into our Google spreadsheet and then into the text editor, TextWrangler. Influenced by Mueller’s approach to “smoothing the text” of the CCC articles that he analyzed (2018, 83), we then worked to manually remove redundant metadata and hyphenated line breaks. We also used TextWrangler’s spell check function to search for places in which imperfect OCR (optical character recognition) scanning misrecognized a word or removed spaces between words. We corrected these errors as best we could, though we think it important to note that our full-text corpus certainly contains some remaining transcription errors given the inconsistent nature of the scans in the JSTOR archive over the years.
Seeking to filter out the “noise” in our corpus, we employed Voyant’s default stopword list, and we also excluded the following overly common words within English Journal itself: teacher(s); teaching; student(s); class; classroom; high; school; English. In addition to excluding common words, our word clouds and graphs also combined some word forms together to make it easier to locate meaningful trends in word frequency. For example, we collapsed the following singular and plural word forms into a single stem word: picture(s); program(s); play(s); film(s); computer(s). We also conflated the following similar words into one frequency category: illus and illustration; TV and television; read and reading; write and writing. Although we recognize that there are significant grammatical and semantic differences between, for instance, words such as “write” and “writing,” we found that we were better able to perceive frequency trends in discussions of “reading” and “writing” over time when we considered all word forms together as one frequency category.
Although we ultimately used Voyant to generate numeric data on word frequency via a process of machine reading, it’s important to note that we see our full text analysis very much as a collaborative process in which we as human readers worked alongside a machine to conduct the analysis. We highlight here the very human process of “smoothing the text” (Mueller 2018), making stopword lists, and combining word forms under common stems in order to emphasize that machine-generated, word frequency analysis necessarily entails complex human (and thus ideologically-loaded) choices of selection and exclusion. In addition to making rhetorical choices of what words to count and how, we also made rhetorical choices of how to visualize them. When we present word clouds of the forty-five top terms across the whole corpus in each decade, we are telling a very particular kind of story that emphasizes chronological development of highly frequent terms—flattening a great deal of the quirky insight that might be found in a closer look at the “long tail” (Mueller 2018) of less frequent terms to be found in differing slices of the corpus. Similarly, in our interactive line graph (Ngram Viewer) of most frequent terms, we consciously chose to focus in on common terms that revealed intriguing patterns that we thought would most be of interest to our audience. While our collaboration with Voyant definitely enabled us to perceive trends in word frequency that we could not perceive through human reading alone, we remain conscious that our own interpretive frames have substantially influenced how we collaborated with Voyant to gather and present our word frequency data.
Case Study Methods
In many ways, our multimodal case studies arose from and were shaped by the process of systematically coding and visualizing the data we have already described. As we mapped out plans for what case studies to include and what questions they might address, we started first by looking at the graphs we made and considering what questions they raised but couldn’t answer. Although the impetus for our case studies began with our graphs, we quickly found that the data we had already recorded through our systematic coding was not sufficient for our attempt to compose detailed “thick descriptions” of some of the more important new media moments in the archive. As a result, we engaged in a deliberate process of re-rereading and note-taking—choosing to carefully reread (or, more precisely, re-reread) all articles about a particular medium within a particular time period.
Whenever we did this rereading for a particular case study, we would alternate years (with each of us choosing to read the years we had not read during the initial coding pass). As we read, we would take notes in a collaborative Google Doc—idiosyncratically recording quotes and paraphrases from the texts that stuck out to us as inspiring, puzzling, troubling, humorous, or otherwise meaningful. As we read and took notes, we also periodically paused to converse (in the Google Doc, or via video chat) about emergent themes and categories we were noticing in the intriguing quotes we had pulled—at times reordering our shared document by emergent theme or category. Our approach to iteratively looking for key themes has some resonance with the inductiveness and recursivity of “grounded theory” (Corbin and Strauss 2000)—though we certainly were not as systematic as grounded theory methods would call us to be because we only “coded” those snippets of the data that we subjectively found interesting. In addition to rereading the articles in our corpus, we also conducted additional, nonsystematic library research to gather and analyze other books and articles from the time period that were engaging similar themes and/or that were referenced within English Journal itself.
Once we started to arrive at a sense of the key stories and themes we wanted to highlight in our case studies, we then began a process of discussing what genres and modalities we might use in each case study chapter—drawing inspiration first and foremost from the genres and modalities of student composing that we saw described in the articles we read. This process of selecting genres and modalities for composing necessarily transformed the stories we attempted to tell. You’ll note, for example, that our videos mostly avoid long quotations of texts, as this scholarly practice would be deadly dull in the context of the genre norms of the videos we are attempting to make. When we change the genres and modalities of scholarly composition, our approaches to argumentation and evidence must necessarily change as well. We ask then that readers approach our digital, multimodal compositions with an open mind—evaluating them according to the evidentiary requirements of historical scholarship, yes, but also according to the constraints and norms of the diverse genres in which they are situated.