Visualizing the Archive
Word Frequencies by Decade
While all the graphs we’ve shown so far have visualized data generated through our own process of human reading and coding, we turn now to present graphs resulting from machine reading of the whole corpus using the quantitative textual analysis tool Voyant. As we present video screencast discussions of the word frequency visualizations, we find that they confirm much of what we noticed through human coding, while also calling our attention to some other aspects of the corpus that our own very human eyes had overlooked.
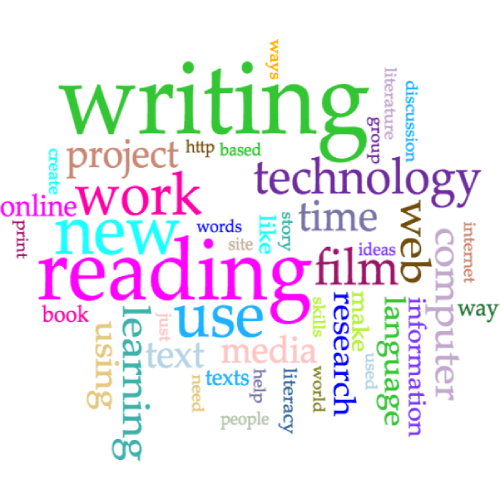
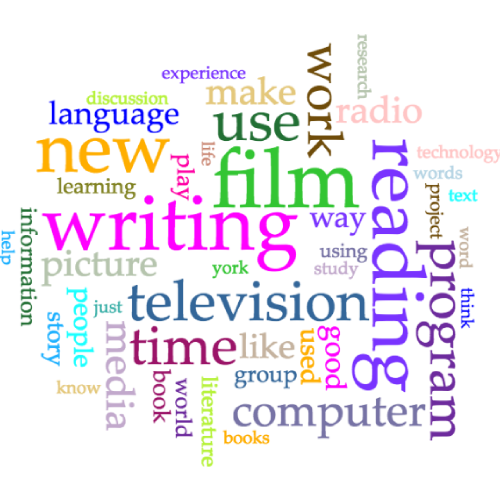
We present first a series of word clouds that visualize the forty-five most frequent words in our entire corpus for each decade (excluding overly common words). In the video screencast below, we have a conversation about some of the trends we noted in how particular words rose and fell in prominence over the decades. That said, we discuss only a few of the many intriguing word frequency trends one might notice; as a result, we encourage you to play with the word cloud slideshow beneath the video and see how it might inspire you to ask questions that we did not imagine.
-
Click to view transcript
Word Cloud Video Tour (.txt version)
[Video: text on screen reads “Word Cloud Video Tour”; transition to green screen footage of Jason standing in front of word cloud screencapture, intercut with footage of clouds, and illustrations of a unicorn, a dragon, and a magic lantern]
Jason: Hello campers! We’re in for a cloudy day in English Journal Land—a word cloudy day! We’ll be tracking historical weather—er, I mean word frequency trends in English Journal on a decade-by-decade basis. You can click through the decades by using the handy arrows on the left and the right side. When you stare at a cloud long enough, you can start to see some intriguing patterns embedded in it, from unicorns to dragons to magic lanterns. In this screencast, we’re going to tell you just a few of the stories that we found when we kept our heads up in the clouds. Join us, will you?
[Audio: harp transition]
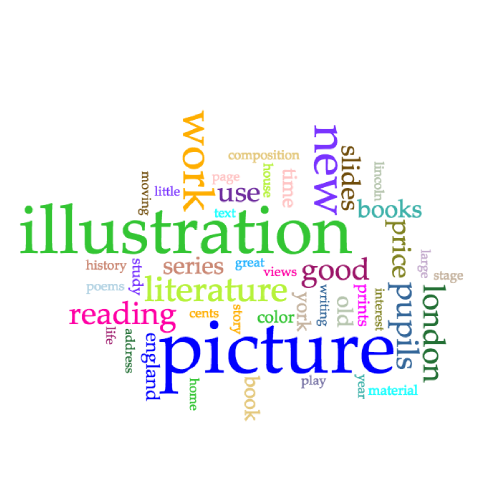
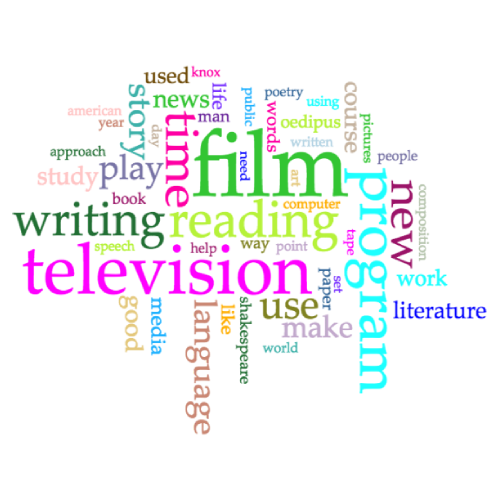
[Video: transition to screencast with inset video of Jason and (intermittently) Ben; screen activity described in narration throughout]Jason: So we’re starting here, 1912 to 1929. We had a little larger time span just because there were so few articles there, and it didn’t start at an even decade. Anyway, what really pops out to me here is the word “illustration” and the word “picture.” So in this time period there was a lot of interest in visual instruction, especially brought on by the rise of various slide projector technologies which we can see here. And most of this use of visual tools was really about supporting the teaching of literature and reading—making literature come alive for students with pictures. Especially British literature, which we can see here with “England” and “London” featuring so prominently.
Ben: I’m kind of drawn in by some of the smaller words. What’s going on right above “picture” there?
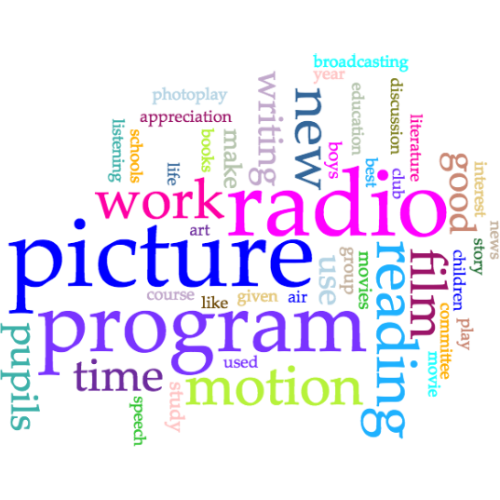
Jason: Oh! “Cents.” You know, I think that might be because so many of these articles were lists of instructional materials that you could order, and things were really cheap back then. All right, let’s take a look at the thirties. Boom! “Radio.” Radio comes in in a really big way, and something that I noticed when that happens is the teaching of reading is still really prominent, but look: “writing.” It barely registered before, but now it’s much more prominent, and this is because teachers were really invested in having students write and perform radio scripts. But it wasn’t just radio scripts. Sure, “picture” is big here, but things have changed. Picture is associated with “motion,” with “film,” so the motion picture, the film, the movie. And the students were also writing scripts for these media as well.
Ben: Another thing I noticed here is this outdated term “photoplay” at the very top.
Jason: Oh, photoplay!
Ben: Yeah, it’s kind of like whenever a new medium emerges, we’re trying to figure out what to actually call the thing—that one didn’t win.
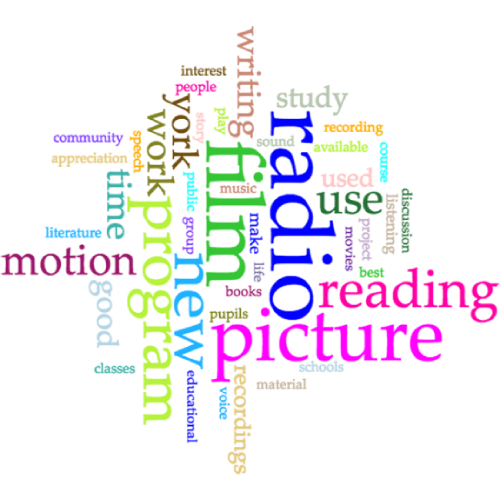
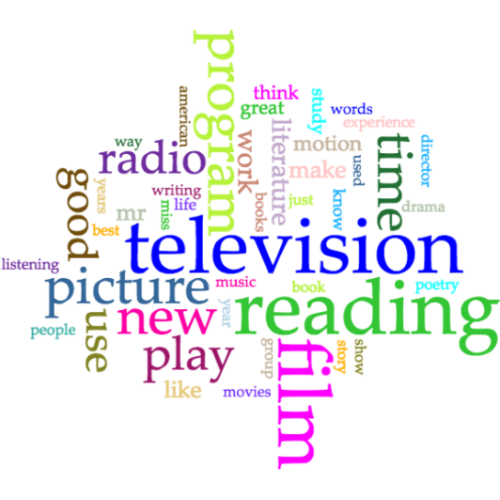
Jason: It didn’t win, but it also says something about English teachers were like, “Okay, we can deal with film because it relates to our historic investment in drama.” So we definitely see remediation at work in a kind of fun and quaint way. So on to the 1940s. Not much new to see here really. “Radio” and “film” are still holding strong. There’s still the interest in the “motion picture” as well. We definitely see “reading” is still dominant, but there’s quite a bit of interest in “writing” as well. On to the fifties, shall we? So in the fifties, boom! “Television”—we haven’t seen that before. It dominates this word cloud in a really big way, and we see “radio” has gotten a lot smaller, so I’m starting to wonder if television really will kill the radio star after all. “Film”—film’s over here still holding its own very much.
Ben: One of the things I noticed is that we start to see a marked shift in the relationship between reading and writing. “Writing” becomes very tiny in the fifties.
Jason: Wait, where’s writing?
Ben: Right above television.
Jason: Oh!
Ben: And I wonder what that’s about.
Jason: That’s super tiny. You know, I wonder if that has something to do with the decline of radio, because there was all that interest in sort of radio scripting, and as you remember, teachers were a little bit more critical of television and how it was taking away from reading, and there was just a greater focus on sort of reading and analysis there maybe.
Ben: Definitely.
Jason: All right, let’s go on to the sixties—one of my favorite decades. So “television” is still here, still strong. “Radio”—I’m scanning all the way around . . . yeah, radio’s gone—
Ben: But there is “tape” right under “program.”
Jason: Yeah, “tape.” So, and I think that suggests “audiotape.” So there’s still an interest in audio. And while we’re looking at the little words—boom!—‟computer.” There are people writing about computers in English Journal in the 1960s in the very earliest days of humanities computing.
Ben: Like literally four or five articles.
Jason: And you know, something that makes me happy is we saw “writing” get demolished in the fifties, but here it’s back together again with “reading” and, you know, relatively equal size and I think that’s pretty cool.
Ben: One other thing. Look what’s right above the word “new” all the way to the right.
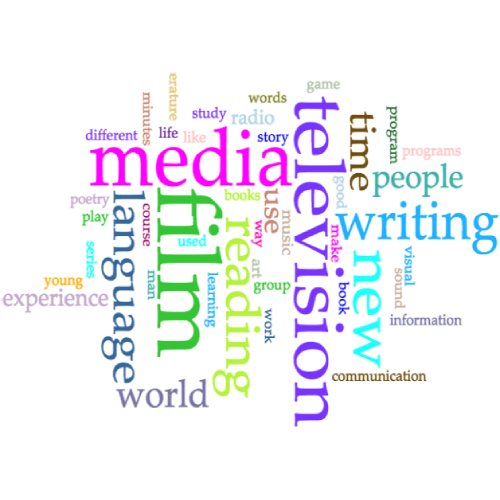
Jason: Oh yeah! “Composition.” So I think this might explain part of the reason why writing’s back. In 1963, a watershed moment, you know on our way to developing a discipline dedicated to writing instruction. You know, maybe there was an impact, who knows? So now we’re here in the 1970s, the grooviest decade. So I’ve noticed that “television” and “film” are definitely still holding their own. Something that makes me super happy is that it’s kind of small, but radio’s back. It didn’t die after all. It’s holding on. Something that really strikes me though is we have a new word emerge that we haven’t seen before in these clouds. “Media.” Right there, big, hot pink, McLuhanesque.
Ben: One thing I noticed in conjunction with media, perhaps even an extension of this growing way of thinking about using media in the classroom, these smaller words like “art” or “music,” or over here on the end, “sound,” “visual,” up at the very top, “game.” Suddenly teachers are a lot more interested in experimenting with these forms or genres and types of text, if you will, that they haven’t been playing with before.
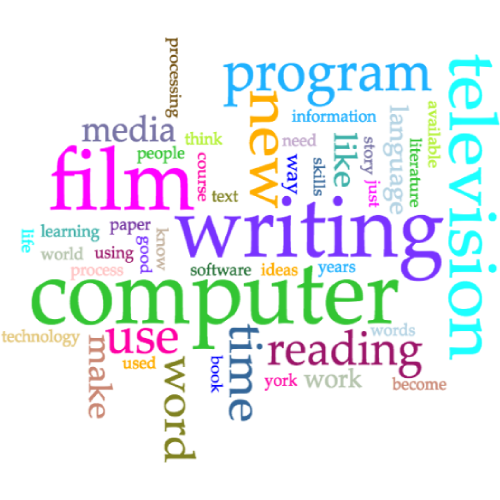
Jason: Whoa! So here we are in the eighties, “computer”—BAM!
Ben: Incidentally in the seventies, computer didn’t even show up.
Jason: Yeah it didn’t. I mean, I’m looking here for it, it’s not there. But here we get to the eighties, and it’s huge. And something that I noticed too is that it’s associated so clearly with writing. And “writing” here is so much larger than “reading,” and that’s also the first time that we’ve seen that in these clouds so far.
Ben: Right. I wouldn’t be so quick to directly correlate them, although I think that’s absolutely a defensible claim. Look at the word “process” right above “computer.” Many of those references in the corpus are to the emergence of process pedagogy. So in conjunction with this new technology that comes on the scene in the form of the personal computer, you also have a really friendly pedagogy that kind of aligns really nicely with it and helps promote writing.
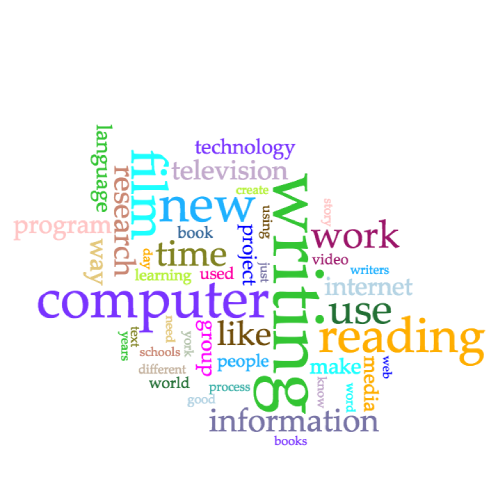
Jason: Yeah I think we always see how pedagogy and technology work together. I also just think it’s worth noticing even though we’re focusing on the rise of the computer here, is that “computer” is definitely existing in an ecology in which “film” and “television” are quite prominent, though it seems like our beloved “radio” is on the fritz again. Alright, let’s go into the nineties, another one of my favorite decades. So what I’m noticing here is “computer” is still pretty prominent and it’s definitely associated with writing, but “computer” is not quite as prominent as it was before and that’s kind of interesting.
Ben: Yeah, one read I have on this is that the term “computer” kind of gets subsumed or minimized or naturalized because of the emergence of proxy terms or synonyms. So for instance, at the top we see “technology,” way over there on the southeast corner we have the word “web”—
Jason: Oh, there it is.
Ben: A little before that, “internet.” The computer as this kind of like generic catch-all term starts to become kind of more diffuse. You even see it in words like “world,” I believe. Probably a lot of instances are about the connectivity and the kind of international reach of networks, that they’re starting to capture the imagination of teachers in the day.
Jason: You know, the World Wide Web, man! And you know, I think actually, it’s the rise of the web which is part of the reason that “writing” is still slightly larger than “reading” here, but “reading” is catching up as teachers are increasingly seeing the web as a space for research and information literacy instruction. Okay, we finally made it into our own century. And what a shitshow of a century it has been.
[both laugh]
Okay, but seriously folks, this is really fascinating. Where’s the “computer?” I can’t find it—oh wait, okay. It’s over here, but it’s really declined in prominence and I’m not quite sure what’s going on with that.
Ben: This is the story of how technologies become naturalized and invisible to us. We don’t even think about them anymore. We see the continuation of these other terms, these alternative terms: “web,” right below it “technology” is this kind of generic catch-all. You even see “HTTP” right under “writing.” Because everybody’s writing for the web. One thing I remember about this, why this is showing up in the corpus, is that so many articles that are emerging at the turn of the century are including these tortured, laboriously long and convoluted URLs that make it real pain to type from print into your web browser.
Jason: Oh absolutely. And you know, I also see “online” as another one of these sort of synonyms from the digital, but something that intrigues me under online is “print” emerges, which isn’t actually a term that we’ve seen a lot. I think there’s something about the rise of the digital that makes people have to specify print as a medium when it is being used in ways that we didn’t see before. I’m also just noticing that “writing” and “reading” are relatively equal—“writing” a little bit more prominent but not as dramatic as we saw it in the eighties. So finally, we’re able to step back and look at all hundred years at once. And one of the things that strikes me immediately, many of the media we’ve been talking about so far feature really prominently. So here’s “film,” here’s “television,” here’s “computer,” here’s “radio.” Another thing that really stands out to me is the prominence of the word “new.” That, if you’ve been paying attention across all these clouds, “new” keeps coming up, so this trope that we need to engage with a particular medium because it’s the new exciting thing actually turns out to be very old.
Ben: Yeah, but that’s not entirely the case. Actually, if you look right under “writing,” you see the word “York.” Sometimes those terms were kind of co-located. This has kind of gets at the messiness of doing any kind of dataviz. You have to account for those kinds of conditions so that’s why you dig a little deeper.
Jason: Sure, New York was a major place for media production, but “new” is so much bigger. The one other thing I notice is we’ve been tracking differences between emphasis on writing and reading, but when we step back from the whole hundred years, they’re relatively about the same size maybe a slight edge to “reading,” but, you know, essentially equal.
Ben: To me, what this suggests is that how you adjust scale allows you to tell different stories. Here, this kind of shows a certain balance between “reading” and “writing,” as kind of coequal arms of the whole literacy enterprise, but if you look decade by decade, you’ll notice that there’s kind of a little back-and-forth, it’s kind of tumultuous. Again, maybe a limitation, maybe a strength of this, but I think the important thing to remember is what we’ve done here is kind of demonstrated this tool for you. Elsewhere on this page you’ll actually see these word clouds, and we invite you to play with them yourself and see what you come up with.
Jason: Yeah, you never know what you might find. Like I’m noticing here “people” emerges, which makes me really happy, and I think would make Cindy Selfe really happy, too.
[Video: text on screen reads “Graphs courtesy of Voyant. Jason’s scarf courtesy of Abby Dubisar. Shot on location in Columbus, Ohio. Edited in ScreenFlow and iMovie.”]
Media assets used in this production listed in Production Notes.
Word Clouds by Decade
While we find the word clouds to be particularly generative, it’s difficult when viewing them to keep track of how individual words rise and fall over time since they are all smooshed together in the same cloud. Taking inspiration from the Google Ngram Viewer, we have built an interactive line graph visualization that enables users to selectively compare the frequency of two or more terms across the decades; all of the terms for the Ngram Viewer appeared in the top hundred most frequent in our corpus (again, excluding overly common words); we selected which terms to include based on our subjective sense of what might be the most intriguing for our users to compare. Once again, we provide a video tour in which discuss some of the term comparisons that we found most meaningful, but we also encourage you to play with the Ngram Viewer yourself and let us know what you notice.
-
Click to view transcript
N-Gram Video Tour (.txt version)
[Video: text on screen reads “Ngram Video Tour”; transition to green screen footage of Ben standing in front of n-gram screencapture]
Ben: Hello there, fellow datavizzers! In this segment we’ll be demonstrating our n-gram tool. Don’t know what an n-gram is? Well, don’t worry, because neither do we! But I think it might have something to do with charting the relative frequency of individual words contained within a corpus. It could be a really useful tool for teasing out comparisons and correlations over time. So let’s get oriented with this tool, shall we? First of all, the vertical axis, it indicates the relative word frequency of a term, and that’s represented in parts per million. The horizontal axis, that’s a timeline, and it’s broken down in decades contained within our corpus. On the far left of the graph are the various terms that we selected to chart. Clicking on a term will turn a line on and off, and you can click on multiple terms as well. If you choose to click on all the terms at once, it’s a really hot mess, but if you’re able to make sense of any of that, please get in touch with us and let us know. But for now, we’re gonna zoom in a little closer and highlight a few of the more noteworthy stories contained in this tool. So let’s just dive right in.
[Audio: harp transition]
[Video: transition to screencast with inset video of Ben and (intermittently) Jason; screen activity described in narration throughout]Ben: Welcome! We’re gonna be playing around with the Ngram Viewer. You might be asking yourself why even use an Ngram Viewer? You have other, more visually dynamic ways of playing with data like the word clouds, but the word clouds show everything kind of crunched together and it’s hard to kind of disentangle or pull things out. An n-gram viewer lets you kind of isolate certain terms and hold them up to others in gestures of comparison, or to tease out correlations. So let’s dig in, shall we? First thing I want to do is look at a comparison between two media forms. Let’s look at radio and television, because as Jason and I like to joke, TV killed the radio star, and let’s see if there’s any empirical evidence to back that up. Here’s radio. Here’s television. And you can see that somewhere between the forties and the fifties there was a marked decline in radio and an ascendancy of television, and so they kind of like crossed paths. Of course, eventually by the time we reached the end of our corpus, both of these kind of fell out of favor, but this kind of reflects one of our central claims: media have lifespans. They emerge, they grow in popularity, they become cultural stalwarts, and then eventually they grow long in the tooth and then sunset.
Jason: Yeah, I think you’re definitely right about that, but the lifespans look different. So let’s take a look here at picture.
Ben: Wow.
Jason: Yeah, so the still image really didn’t have a long lifespan, but now let’s look at film. You know, film crests here in the forties, but it really keeps going strong. No longer called a motion picture, clearly, as time goes on. And you know, it only starts a bit of a decline in more recent years.
Ben: This makes me think, too, like given the comment about motion picture, this doesn’t tell the entire story. If we’re able to disambiguate between picture versus motion picture that decline might be even more pronounced.
Jason: Right, so basically if we knew what the hell we were doing with corpus linguistics, this would be better.
Ben: Okay, fair enough. Now let’s reset. Let’s look at “computer.” It’s an interesting timeline in and of itself. We’ve talked about this elsewhere in the book, but the 1960s you see a small blip when people are talking about using mainframes and punch card-related kind of machines, and then it kind of disappears in the seventies. And then with the rise of the PC, you see a massive explosion. So this kind of follows a different kind of trendline from the other media forms. There’s this almost false start, and then the real show begins. This doesn’t actually tell the whole story, though. Because into the nineties, into the 2000s, we’re obviously still very much invested in computers in the English classroom, and the corpus reflects that. But the use of the word “computer” is the sticking point, because as we know, other words tend to take the place of it—proxy words, words that kind of get at the digital. So you see this ascendancy of the term “technology” over this time as well.
Jason: Yeah. I mean, I notice technology actually becomes more popular than computer in our current century, and yet so often that term is restrictively used to refer only to the digital.
Ben: Right. So let’s look at something else now—the relationship between reading and writing. We’ve talked about this elsewhere in our project, but here we can see a fairly interesting story emerging. If we compare this hot pink and this brown line—I have to say, is there any reason why we pick the colors we did for this this chart Jason?
Jason: Because writing is fabulous! [Ben laughs] It needed the most fabulous color—clearly!
Ben: Wonderful. So you see an interesting shift that happens in between the sixties and the seventies. I don’t know if it correlates, but you know, composition as a discipline kind of emerging into its own, the emphasis on expressivist pedagogies, on process pedagogy—all of this is kind of like building this momentum. Maybe there’s a correlation there that’s worth exploring further. But it’s interesting to note that the English Journal corpus we deal with is predominantly K-12. Regardless, reading is the thing up until this moment, and then they switch places, but ultimately arrive at roughly equivalent statuses.
Jason: Yeah, but this gets a lot more exciting when you put writing up against computer: Boom! green computer line, pink writing line. They meet together. Both have their high mark by far in the corpus in the 1980s. Coincidentally, really the moment when computers and writing begins to coalesce as an important subfield in English studies.
Ben: There’s a small handful of moments in this research project that made me go, “Aha!” and this is one of them. This is where I see—and granted, this doesn’t tell the entire story, but there’s a good case to be made that that computer was instrumental (pun intended) as a tool for promoting writing. So what else do we want to look at?
Jason: Yeah, you know, I also think about some of the positive affect words. Like, here’s one of my favorites when I was playing around with it. So, you’ve got good—you know, that’s pretty persistent. And then here in the pink you have like, but there’s like just this modest little thing that you see somewhere in the sixties. New media seem to become less good, but people liked it way more. [both laugh] Okay, I’m probably making a lot out of a small distinction, but still, I think the broader point here is that positive affect words definitely tended to correlate more than negative affect words when we were doing this analysis.
Ben: And this is absolutely the point of using tools like this. They don’t let you arrive at dead-certain conclusions, but they open the door to ask questions and to see big bodies of texts in new ways. Anything else?
Jason: You know, there’s this one other that was on here. I just noted time. It was appearing quite frequently throughout all the decades. And of course time’s a really ambiguous word. Like, is it referring to the time the radio or TV program is on? Is it referring to the time pedagogy takes? Or in my most fanciful way of thinking, I think it refers to the sheer amount of time it took us to prepare this full text corpus for reading. [Ben laughs] In any sense, it also just points to some of these everyday words that show up a bit more than we might otherwise expect. The only other one out there is process, and if you put that up against writing, I think one of the things that’s sort of interesting about this, process is the sort of huge god term for us, and yes, you see you see here in the 1980s it has its apex when writing has its apex, but it clearly wasn’t at the same level of frequency as the notion of writing. And you know I’m still pondering what that means, but I’m intrigued by it.
Ben: Right. And again, this is part of these strengths and the limitations of these types of methods and this particular type of methodology. But well said, Jason. And I guess with that I would say that we are out of time. So we invite you to, yes, go and play with our Ngram Viewer. Maybe you see things that we haven’t noticed here. So go have fun.
[Video: text on screen reads “Frequency analysis made with Voyant. Graphs made with D3 JavaScript Library. Jason’s scarf courtesy of Abby Dubisar. Shot on location in Columbus, Ohio. Edited in ScreenFlow and iMovie.”]
Media assets used in this production listed in Production Notes.
N-Grams by Decade
-
Click to view graph data in table format
N-gram Table by Decade
1912 - 29 1930s 1940s 1950s 1960s 1970s 1980s 1990s 2000 - 12 Book 0.003865 0.001656 0.001639 0.00189 0.001421 0.001558 0.001278 0.001817 0.001881 Computer 0 0 0 0 0.000676 0.000308 0.004834 0.00253 0.001535 Film 0.000176 0.002165 0.004933 0.003908 0.005189 0.003896 0.005056 0.002534 0.001961 Good 0.001933 0.001469 0.001436 0.001756 0.001117 0.000789 0.00092 0.000789 0.000559 Group 0.000452 0.001413 0.001605 0.001133 0.000866 0.001568 0.000967 0.001755 0.001596 Like 0.000728 0.000856 0.000693 0.001246 0.001011 0.001041 0.001597 0.001644 0.001227 Literature 0.00246 0.000947 0.000963 0.001359 0.00117 0.000774 0.000703 0.000645 0.000955 Make 0.000853 0.001128 0.001407 0.001161 0.001216 0.000984 0.001418 0.001086 0.001157 Media 0 0.000007 0.000059 0.000609 0.001003 0.003603 0.001521 0.001079 0.001436 Picture 0.006375 0.005053 0.00424 0.002428 0.000555 0.000507 0.000451 0.000507 0.000327 Process 0.0001 0.000125 0.00011 0.000248 0.000448 0.000605 0.00072 0.000507 0.000327 Program 0.00005 0.003703 0.002711 0.002273 0.002378 0.000882 0.002492 0.001251 0.000327 Radio 0 0.004782 0.005566 0.002088 0.000608 0.001148 0.000294 0.00031 0.000048 Reading 0.002083 0.002499 0.002517 0.003901 0.002165 0.002307 0.002138 0.002317 0.003416 Technology 0 0.000042 0.000025 0.000014 0.000076 0.00021 0.000716 0.00112 0.001826 Television 0 0.00001 0.000076 0.00417 0.003358 0.003849 0.003639 0.001369 0.000285 Time 0.001506 0.001824 0.001664 0.002188 0.002006 0.001748 0.002168 0.001665 0.001638 Writing 0.00118 0.001517 0.001225 0.000885 0.002067 0.002455 0.004954 0.004158 0.004499